Spotify Around The World
In my Advanced Interactive Multimedia class, one of the main focuses was learning new javascript libraries and tools outside of standard javascript and jQuery. The two we focused on the most ended up being Node and React.
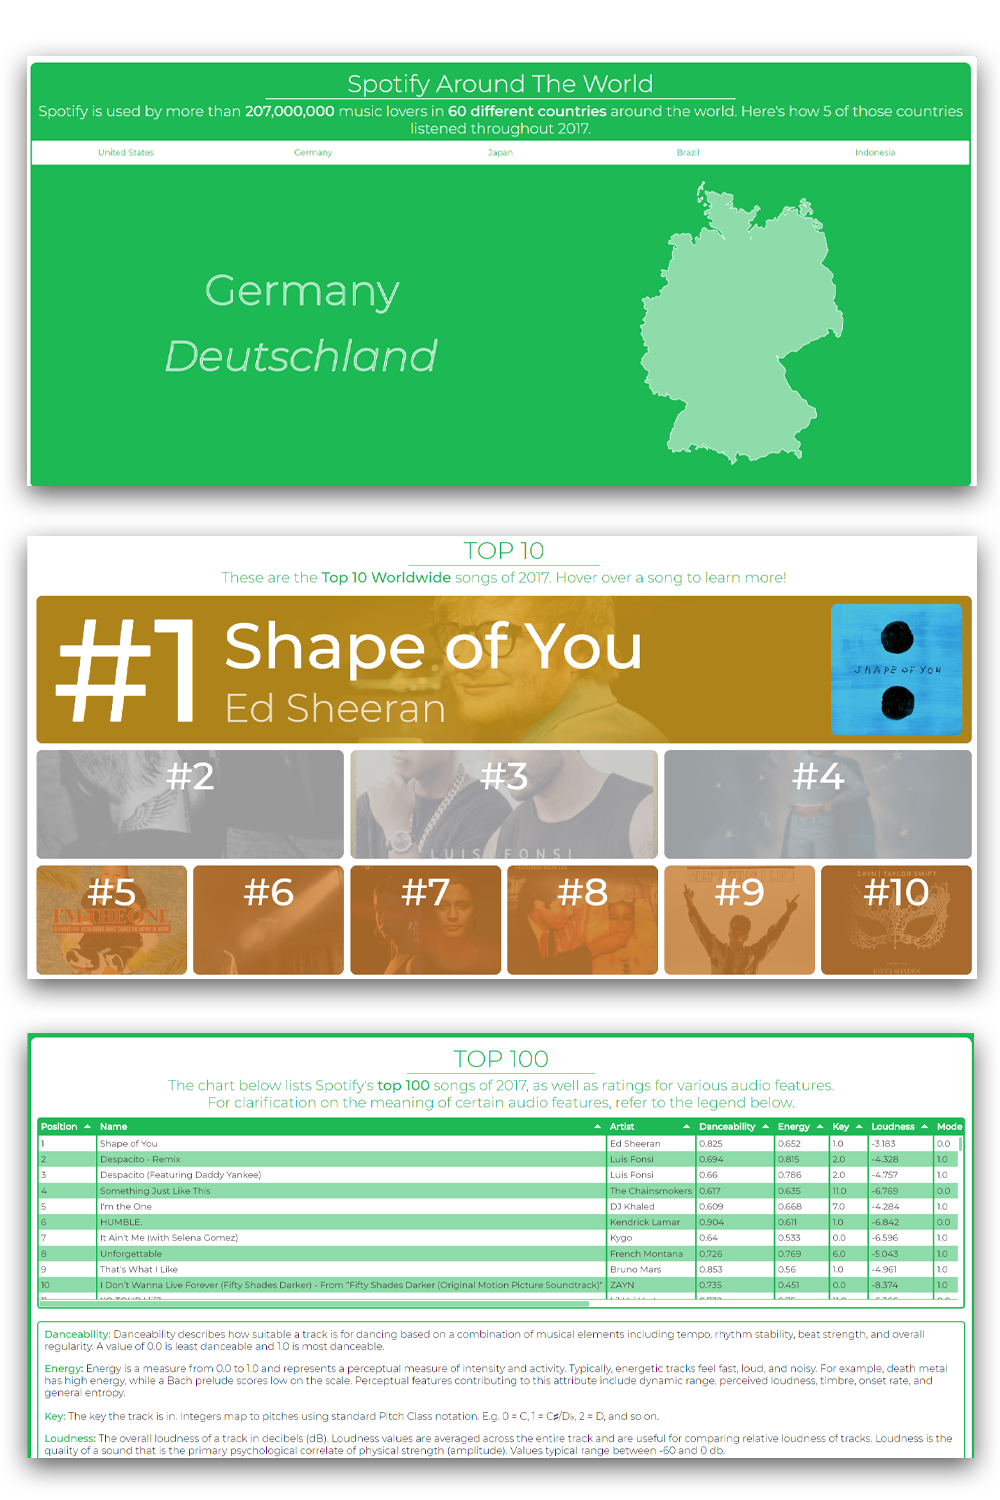
For this project, we were encouraged heavily to draw from large data sources and use Node to help organize and prepare the data - so I ended up downloading an absolutely massive set of Spotify data. This dataset showed the Top 200 songs for each day in each of the 53 countries in which Spotify was active in 2017. To sift through this data, I used node to pare it down to the top 10 songs 5 countries for the first day of each month in 2017 - reducing appx. 3.44 million lines of data to about 600 lines. Much more manageable.
From there, I populated a chart with the data for each country and created a menu to pick from which would draw an SVG representation of whichever country you picked upon clicking, as well as displaying that country's chart and hiding any others.
In terms of effort, this part of the project was the hardest. The rest turned into more of an exercise in aesthetically pleasing HTML and CSS, all strung together through some basic react components. Using another set of Spotify data for the top 100 songs of the year, I made an interactive top 10 list using HTML/CSS, a graphic showing which artists had multiple top 100 songs, and a table of stats for each song using tabulator.
The project was entirely developed in VScode and managed through Git, where it's hosted currently.